Exporting to NetworkX
When converting to a NetworkX graph there is only one function (to_networkx()), which has flags for node and edge history and for exploding edges. By default all history is included and the edges are separated by layer.
In the below example we call to_networkx() on the network traffic graph, keeping all the default arguments so that it exports the full history. We extract ServerA from this graph and print to show how the history is modelled.
The resulting graph is a NetworkX MultiDiGraph since Raphtory graphs are both directed and have multiple edges between nodes.
We call to_networkx() again, disabling include_property_history and include_update_history, then reprint ServerA to show the difference.
Visualisation
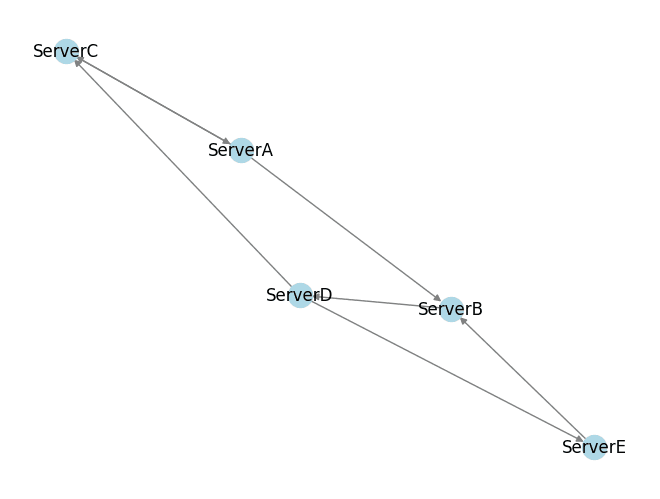
Once converted into a NetworkX graph you have access to their full suite of functionality. For example, using their drawing library for visualising graphs.
In the code snippet below we use this functionality to draw a network traffic graph, labelling the nodes with their Server ID. For more information, see the NetworkX documentation.