Get started
Raphtory is a temporal graph database and analytics tool that you can use to investigate social graphs, detect fraud in financial transactions, power graphRAG AI systems, and much more.
Our powerful visual interface allows analysts to explore data and trace the evolution of relationships across time. Data scientists can use APIs to create repeatable analytics pipelines using our built in filters and metrics or add their own custom algorithms.
Raphtory is written in Rust for speed and safety. However, you can interact with your graphs using:
- Python - Our Python APIs are the primary way to create workflows and are described in detail in this documentation.
- GraphQL - Start a GraphQL server that you can interact with programmatically or using the playground integrated in the Raphtory UI.
- Rust - Interact directly with the Rust library to add new algorithms or build into fully featured products.
To cite Raphtory in your work refer to our paper Raphtory: The temporal graph engine for Rust and Python.
Ingest a simple dataset
You can build graphs directly in Raphtory or import data from standard formats/tools (CSV, Parquet, Pandas, Duckdb, etc). In the following example we use the OBS baboon interaction dataset from SocioPatterns which is provided in a tab separated text file. We have added an additional column weight to the dataset as a numerical representation of the positive and negative interactions between baboons.
The Data Model
Raphtory can load data directly from CSV files. Create a new graph g and use the .load_edges() method to load the edges, mapping columns to source, destination, time, properties, metadata and layers.
By default, Raphtory will infer types from strings in CSV files. However, you can explicitly set the schema for columns using the schema parameter with PropType values. When loading from typed sources like Parquet, Pandas DataFrames, or DuckDB, their schema will be used automatically unless specified otherwise.
You can print the graph object to verify it was loaded correctly. Note that the earliest_time and latest_time are given in Raphtory's EventTime format.
For more details, see Creating a graph.
Query your data
Once you have created a graph you can start to analyse it and isolate interesting features.
Nodes and edges
You can access individual nodes and edges directly using the .node() and .edge() methods:
For more details, see Querying your graph.
Algorithms
Raphtory includes many built-in graph algorithms. For example, you can use PageRank to find important nodes:
For more algorithms, see Running algorithms.
Once you have identified some interesting features, you can perform more detailed analysis by filtering your results or examining them across a window of history.
Start the UI server
To start the Raphtory UI you need to:
- Create a GraphServer and client. Every
GraphServerneeds a working directory, you can name this anything. - Start the server and get a RaphtoryClient.
- Send the relevant graphs to this client (in this case you only have one graph available).
This will start the UI locally on the default port 1736.
You can also start a standalone server using the Raphtory CLI tool or Docker image.
Querying via GraphQL
You can query the graph programmatically using GraphQL. The GraphQL API mirrors the Python and Rust APIs, so the same methods and properties are available across all three interfaces.
Using the UI
When you navigate to the server URL, you should see the Search page by default:
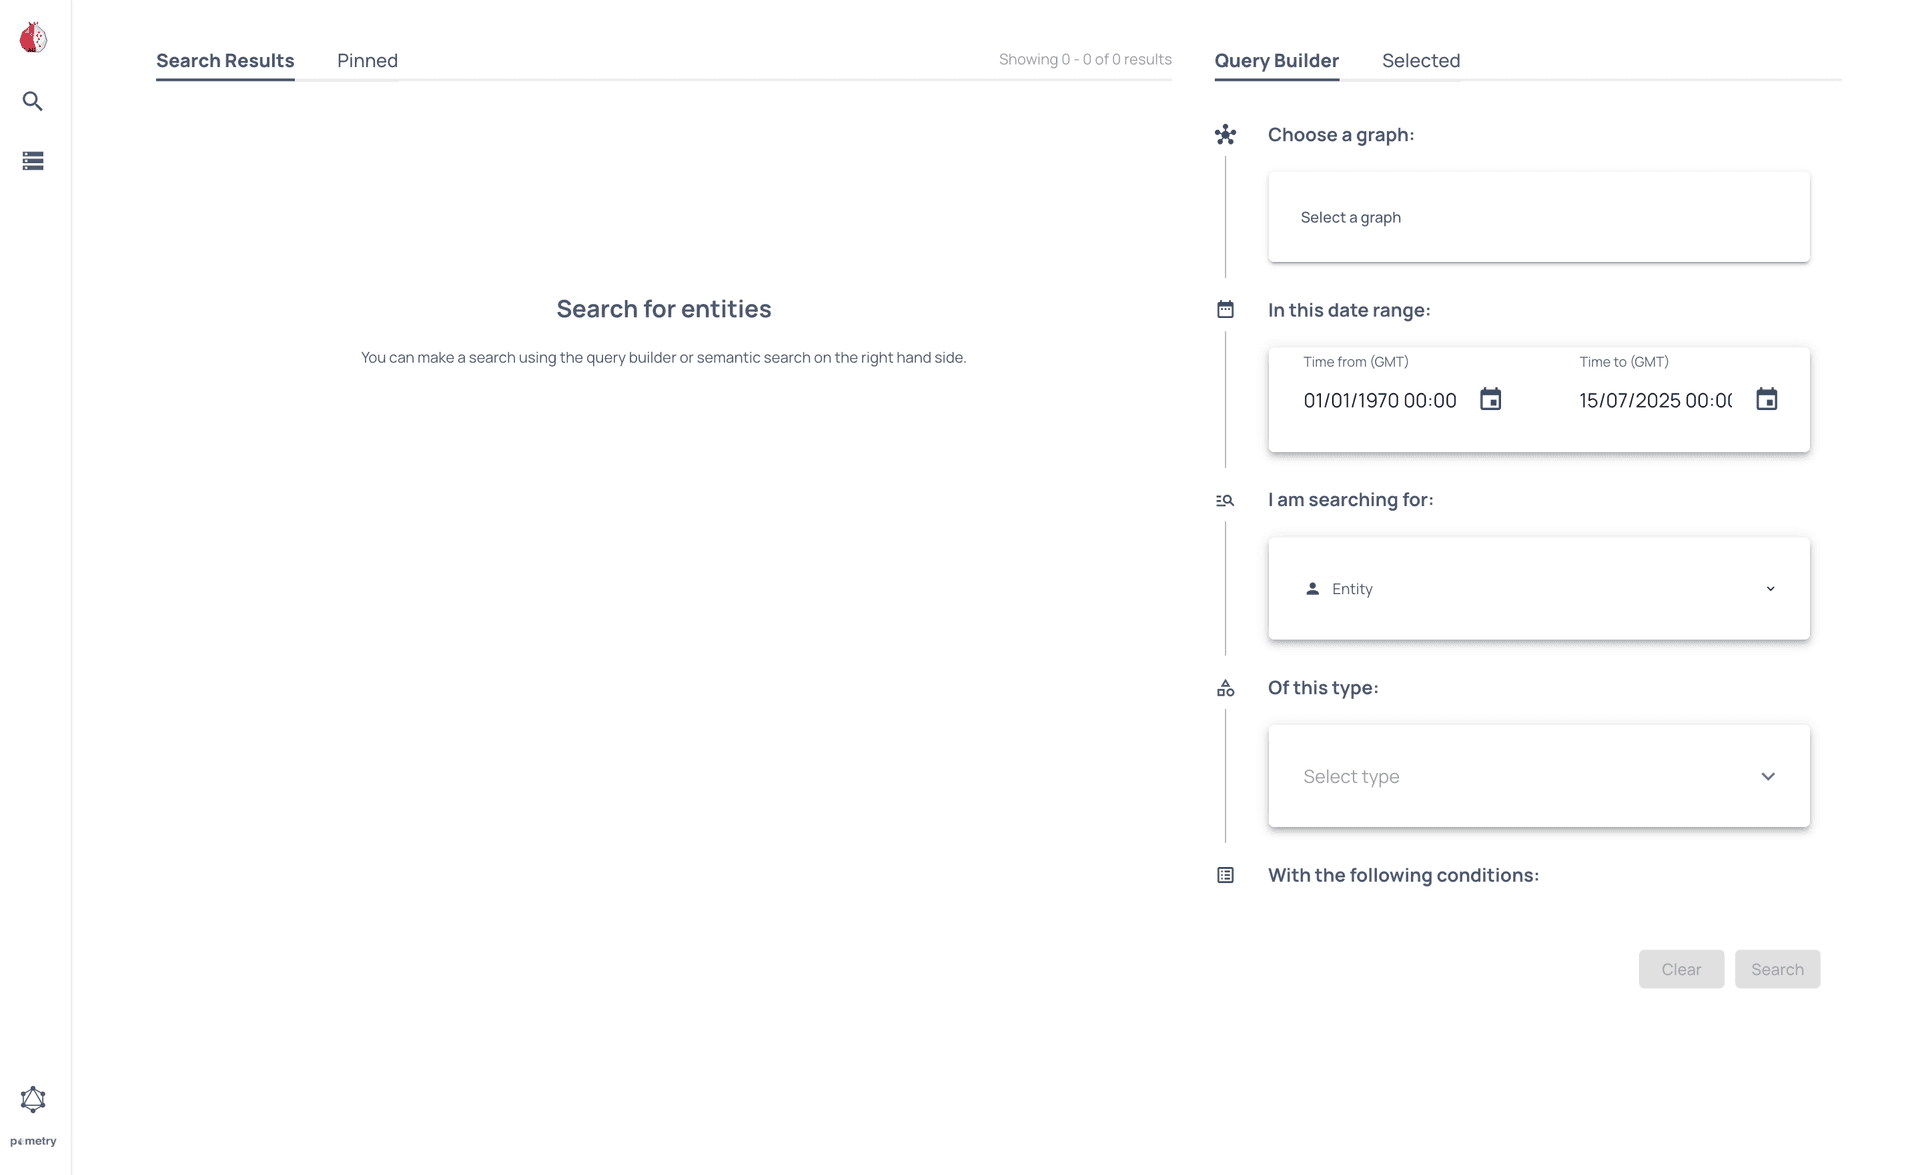
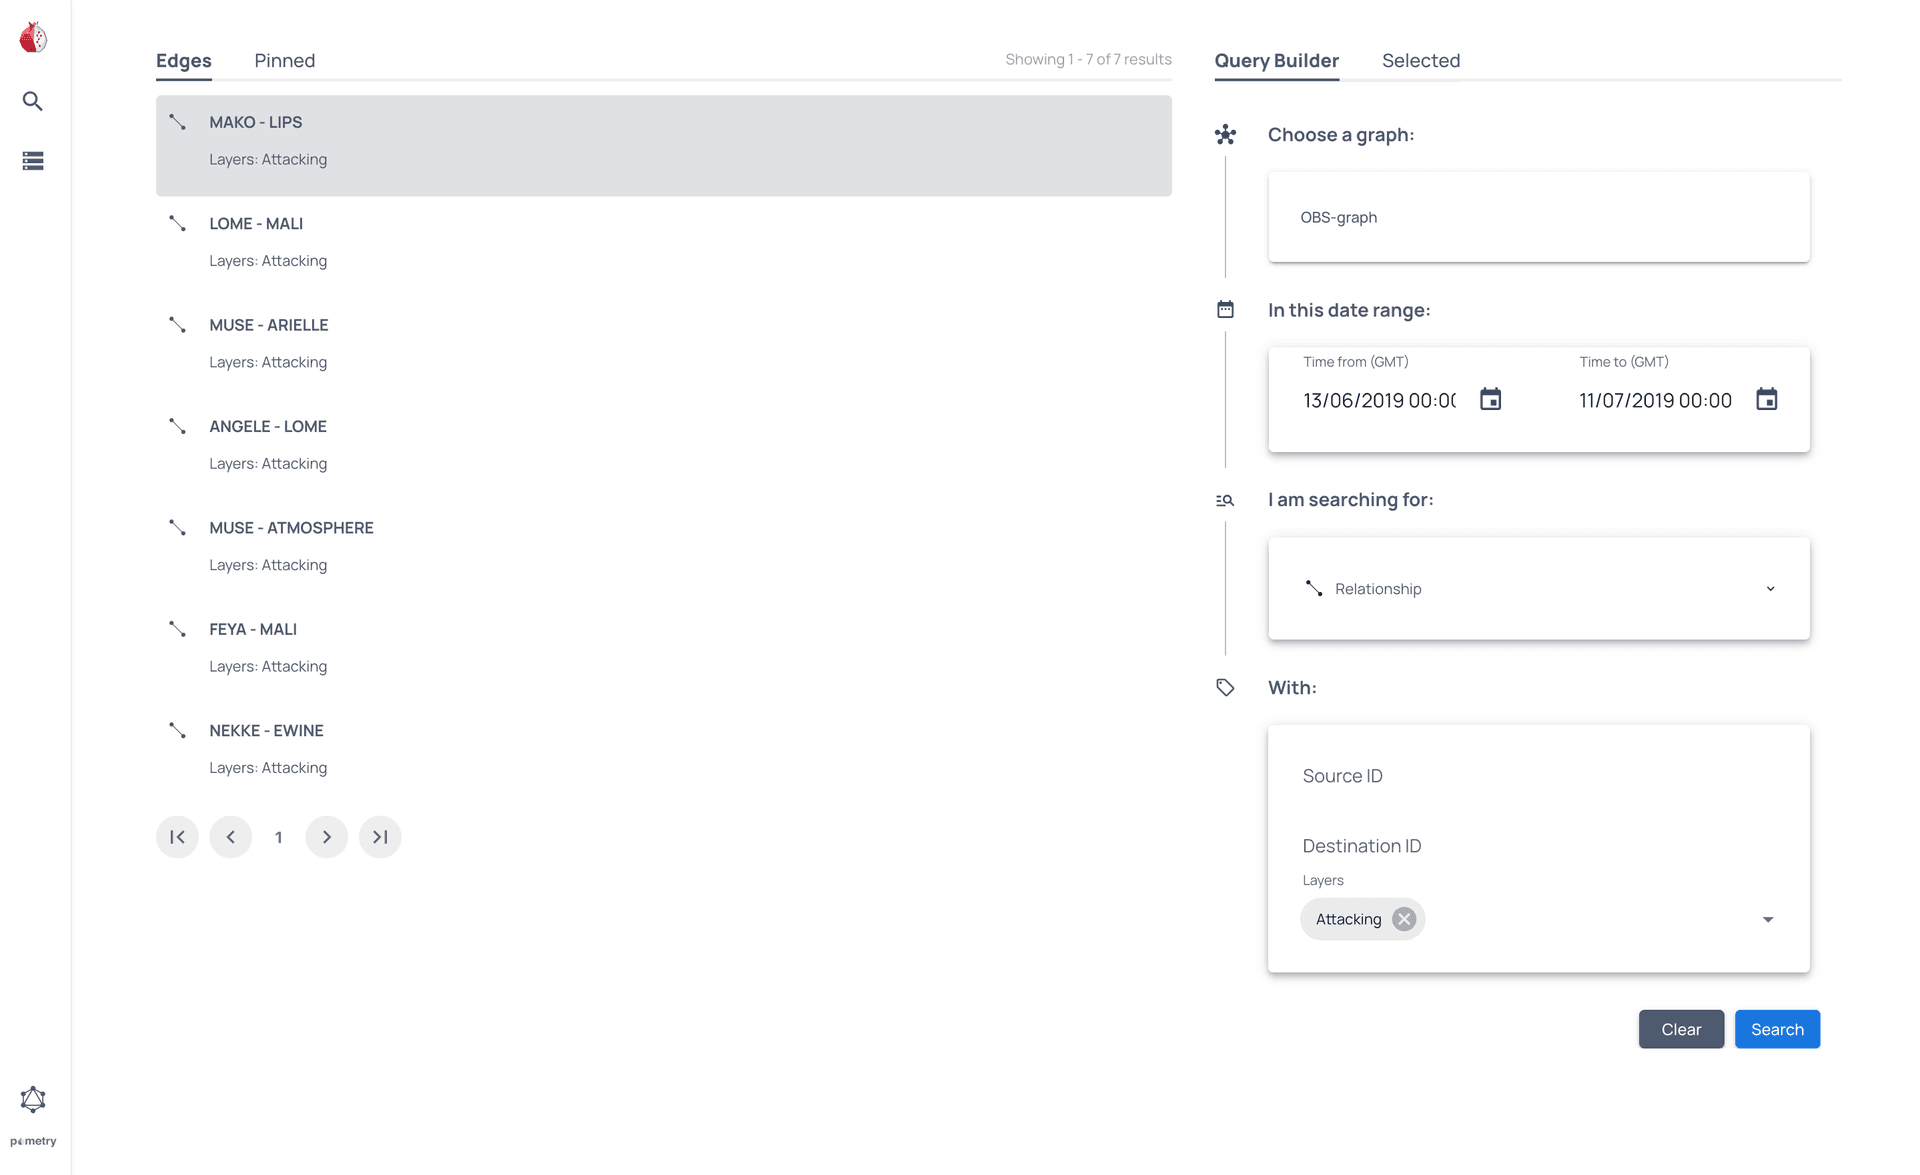
You can use the Query Builder to select the graph you created and identify which baboons attacked each other in the last month.
For more information see the full User Interface overview or the GraphQL API reference.